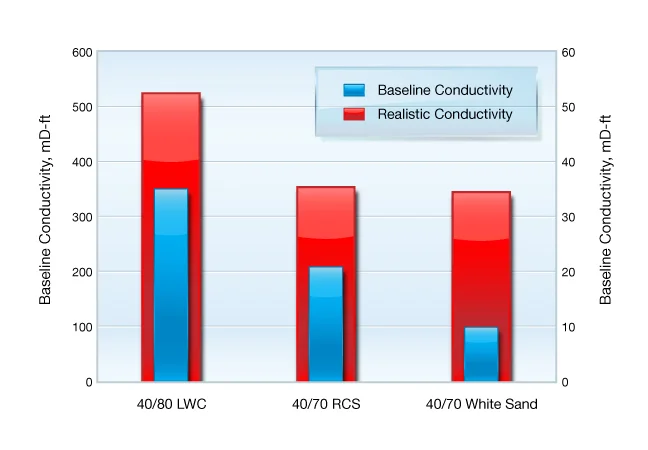
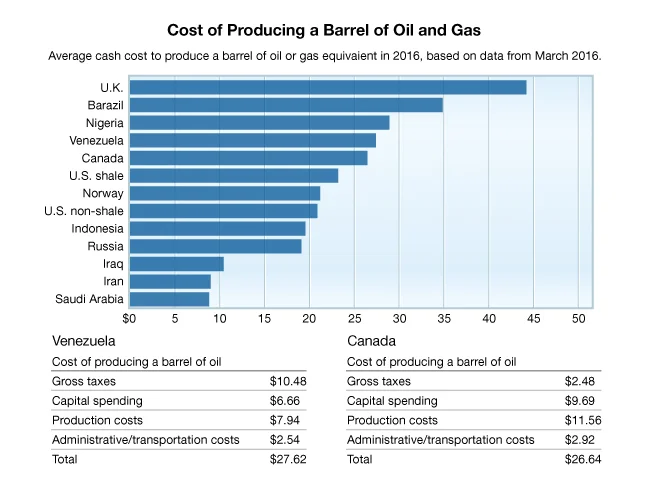
This graph style provides visual appeal to a simple bar chart, and also serves to brand IHRDC graphs/charts.
(Illustrator)
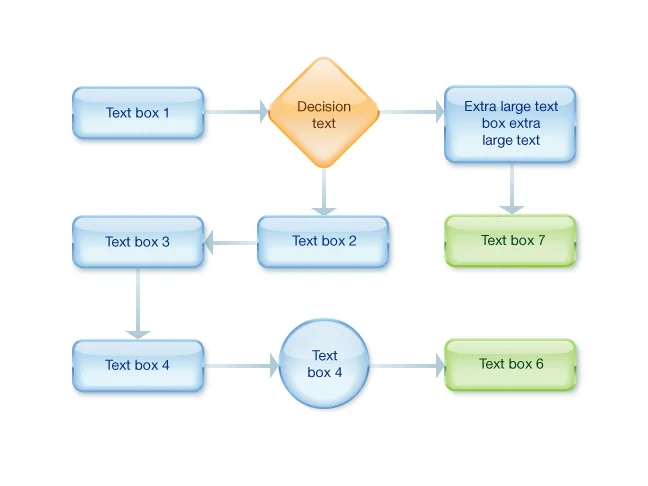
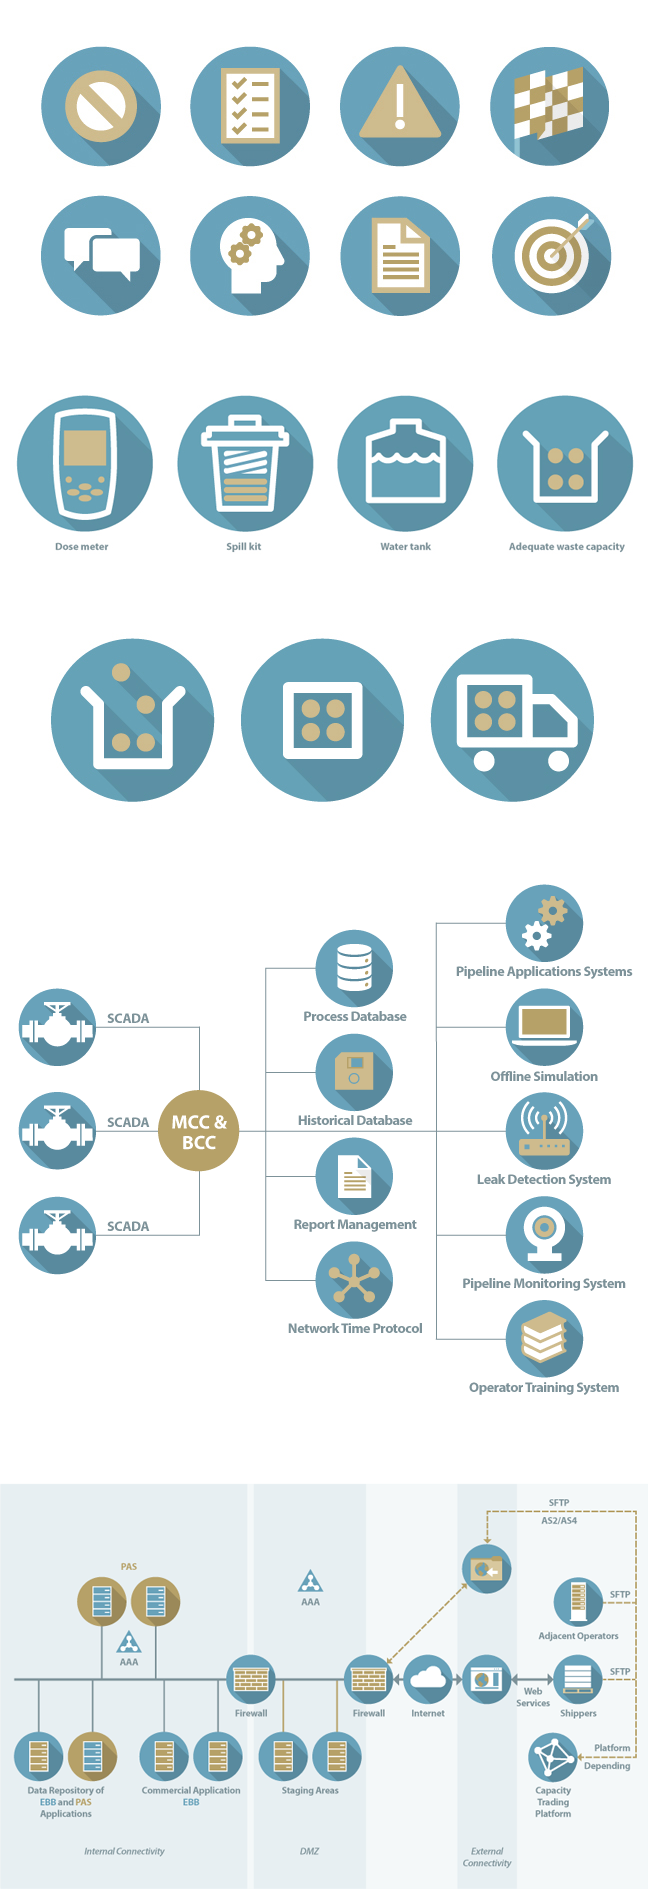
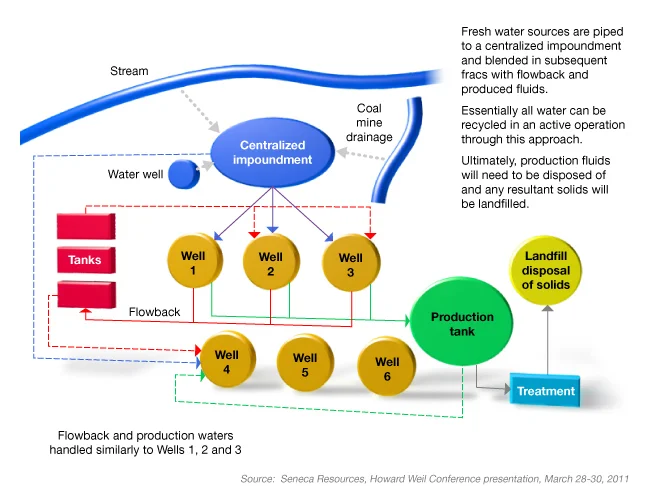
Glass effect flow chart style for IHRDC.
(Illustrator)
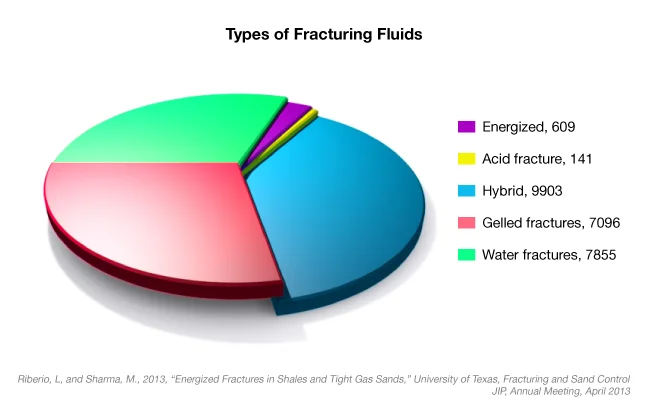
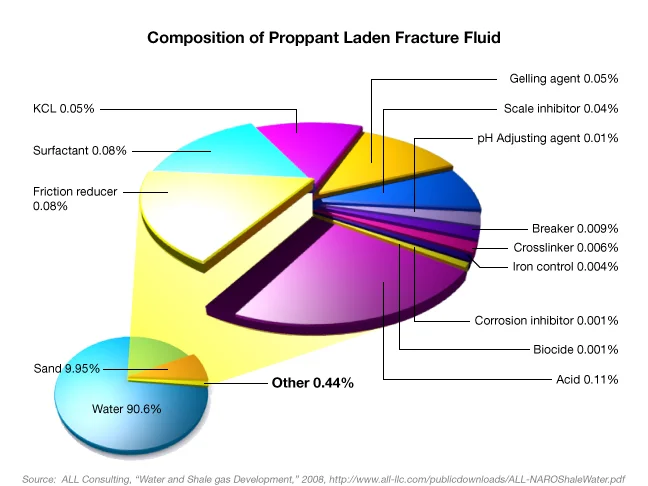
Pie chart created in 3ds Max.
(3ds Max, Illustrator)
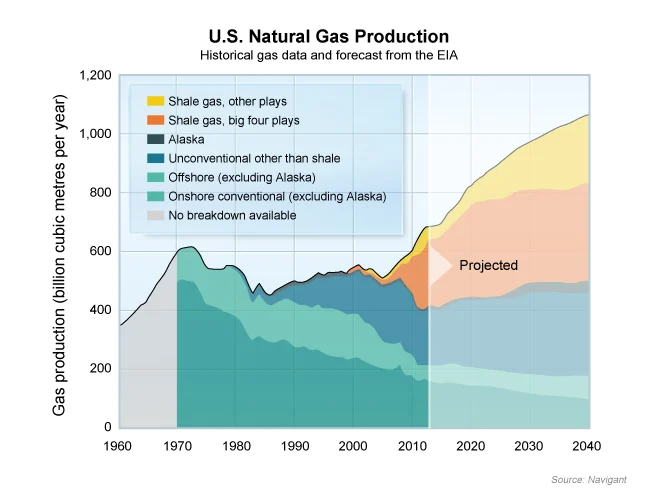
This "glass" graph style serves to brand IHRDC graphs.
Diagram/icon style created for IHRDC client, TANAP, the Turkish transnational gas pipeline project, using their organizational colors, blue and brown.
(Illustrator)
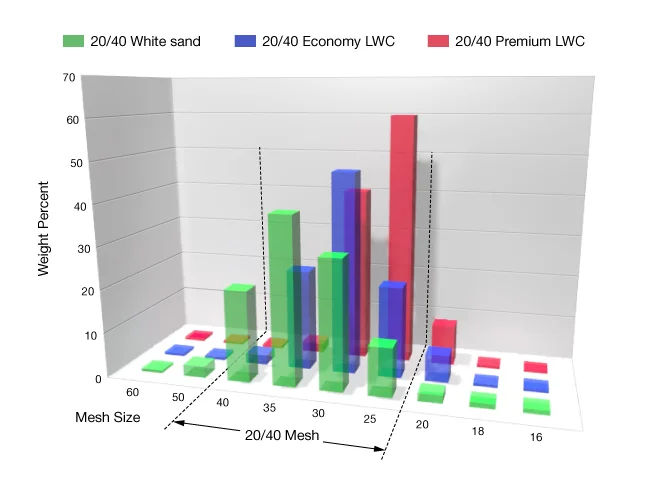
This 3-dimensional bar graph provides 3 axes of information.
(3ds Max, Illustrator)
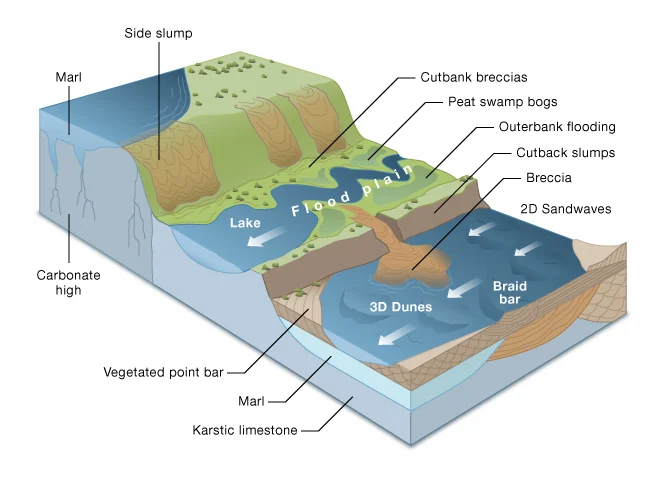
Geology infographic
(Illustrator)
eLearning icon set created for TANAP, the Turkish transnational gas pipeline project.
(Illustrator)
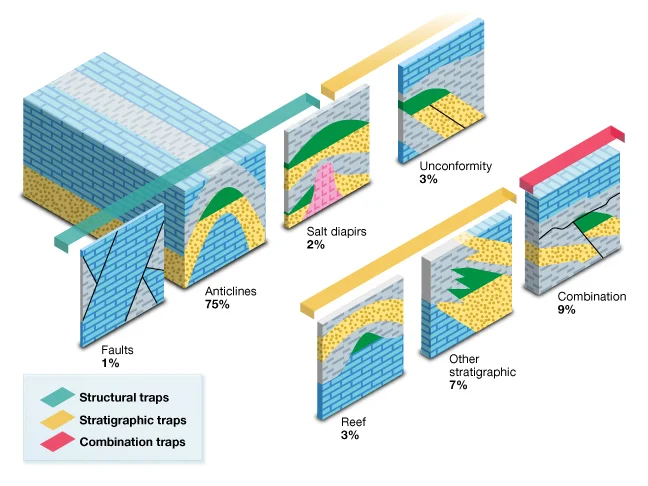
This infographic visually represents the percentages of geological "traps," and also groups the traps into three categories..
Text was carefully positioned and leader lines were carefully designed to create a pleasing pattern.
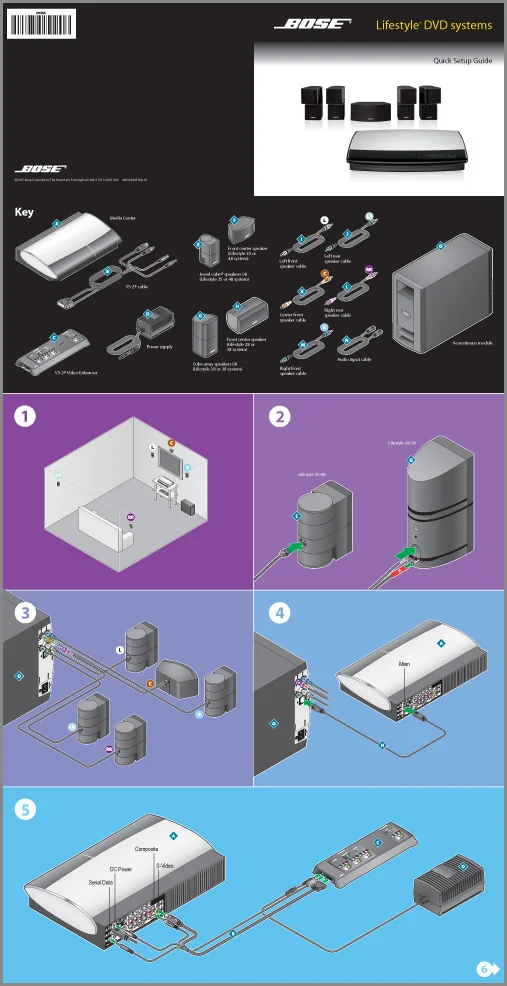
Award winning Bose user documentation.
"Best of Show," 2009 Society of Technical Communications, Northeast
(Illustrator, Indesign, Photoshop)
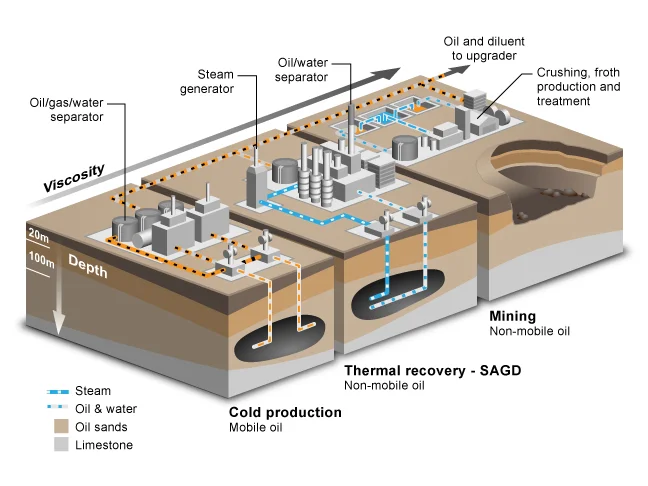
This infographic communicates a lot of information quickly.
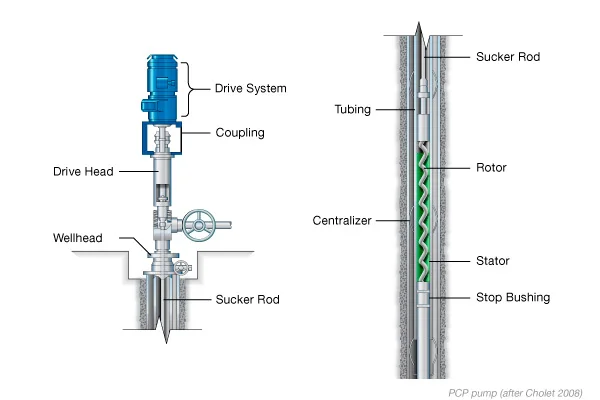
Oil well diagram.
(Adobe Illustrator)
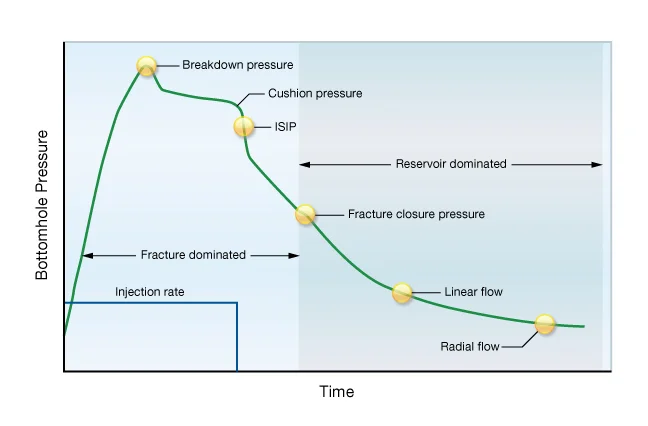
Tightly organized graph with text.
(Illustrator)
Illustration/graph hybrid.
(3ds Max, Illustrator, Photoshop)
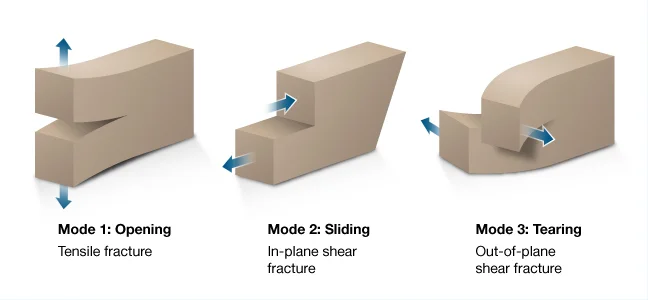
Pictorial representation of rock deformation types.
(Illustrator)
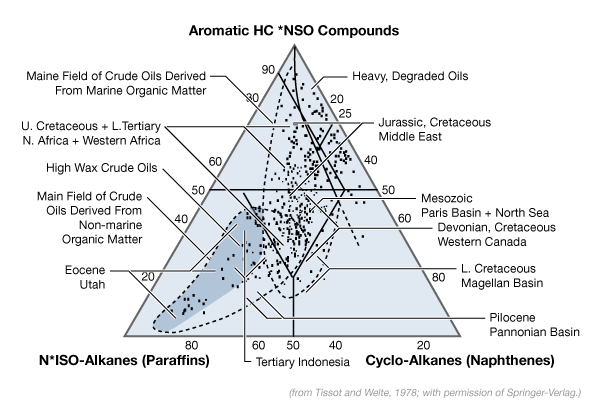
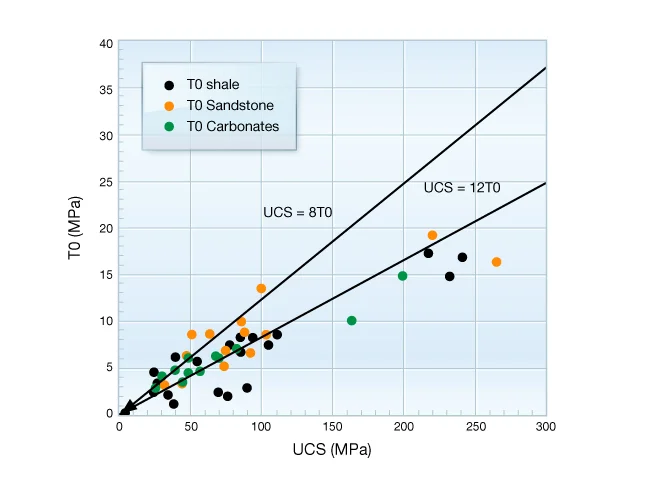
Scatter graph with IHRDC branded "glass" graph.
(Illustrator)
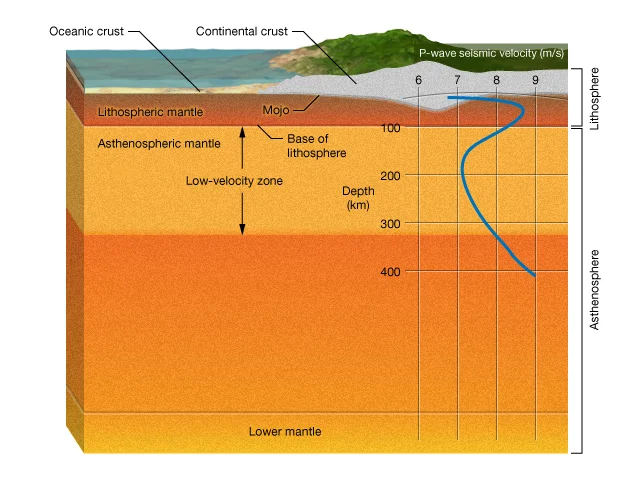
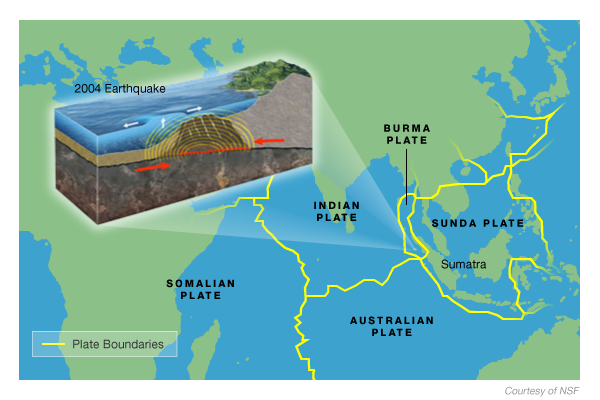
3D graphic merged with map illustration.
(Illustrator, Photoshop)
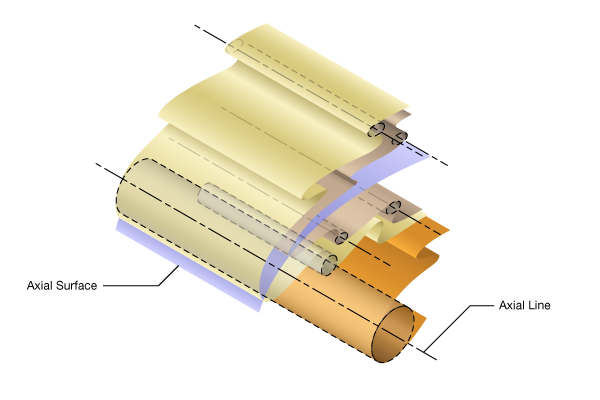
Pictorial diagram representing fold types and terms.
IHRDC graph in branded style.
(Illustrator)
Three-dimensional diagram created in 3ds Max.
(3ds Max, Illustrator)